Customer Segmentation with Clustering
Overview
Problem Statement: Understanding and serving customers are key retail marketing goals. This project applies clustering to segment customers from an e-commerce dataset (951,668 orders, 2012-2016) across five continents, using demographics, behaviour, and purchase data to enhance marketing efficiency, customer retention, and resource allocation.
Approach: The process involves data exploration, preprocessing, feature engineering (e.g., Frequency, Recency, CLV), EDA with visualisations, clustering via K-means and hierarchical methods, and dimensionality reduction with PCA and t-SNE. A report summarises insights for stakeholders.
Project Stages
Data Exploration
Imported data, identified missing values (e.g., City, Postal Code), removed duplicates, and handled outliers (5% via Isolation Forest). Aggregated to one row per customer.
Feature Engineering
Created Frequency (order count), Recency (days since last order), CLV (revenue - cost), Average Unit Cost, and Customer Age from birthdates. Scaled features for analysis.
Clustering & Reduction
Performed EDA, K-means (k=2, 5), hierarchical clustering, and reduced dimensions with PCA/t-SNE to visualise customer segments effectively.
Feature Engineering Process
Days since last purchase
Number of orders
Revenue - Cost
Average cost per item
Customer age from birthdate
Workflow
Clustering Methods
Elbow & Silhouette
Elbow method suggested k=5 (gradual SSE drop); Silhouette scores peaked at k=2 (0.42) and k=5 (0.35), indicating well-separated clusters.
Hierarchical Clustering
Applied on 10,000 samples with dendrograms; k=5 showed distinct splits (e.g., high CLV vs. low recency), confirming segmentation viability.
K-Means Clustering
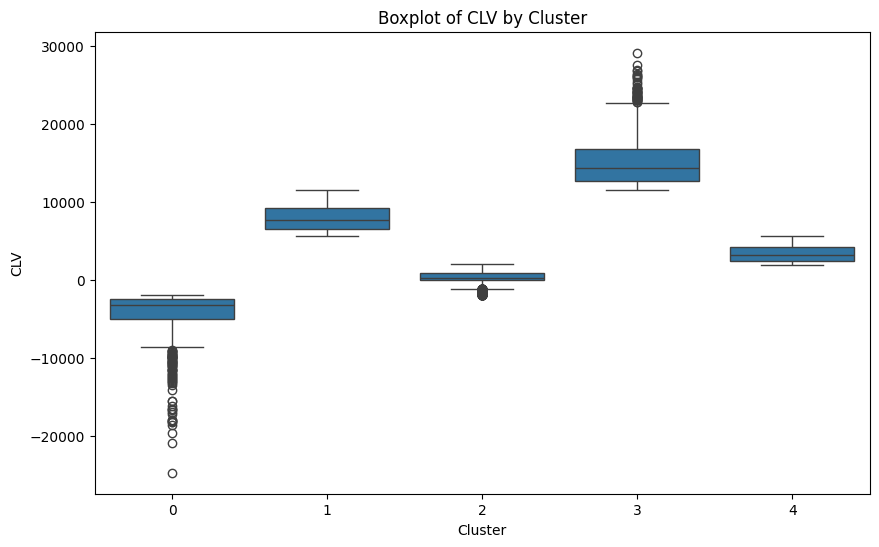
Tested k=2 (high vs. low CLV) and k=5 (varied CLV, age, recency); k=5 provided nuanced segments for targeted marketing.
Silhouette Score Comparison
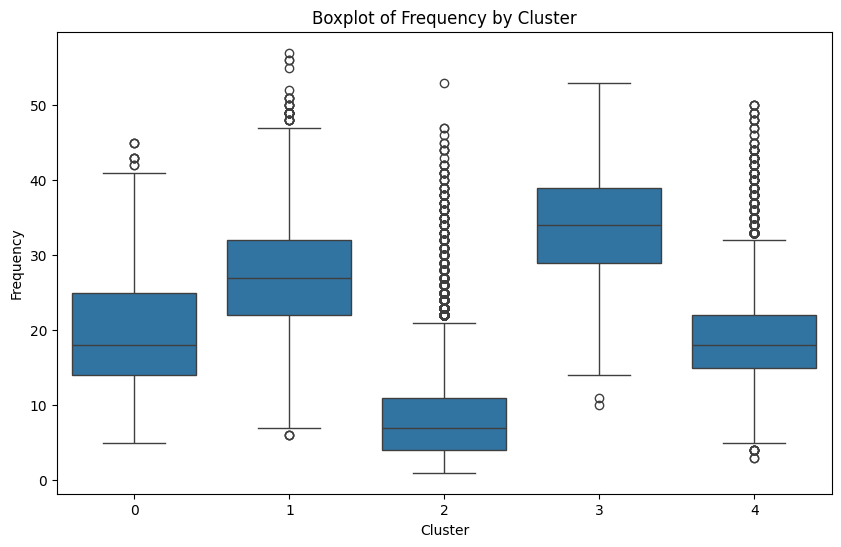
Customer Segments (k=5)
Mature Budget
Older, low CLV, variable unit cost
Recent Explorers
Most recent purchases, low CLV
Mid-Value Regulars
Moderate CLV, mixed age demographics
Young VIPs
Young, high CLV, frequent purchases
Dormant Midrange
Least recent, moderate unit cost
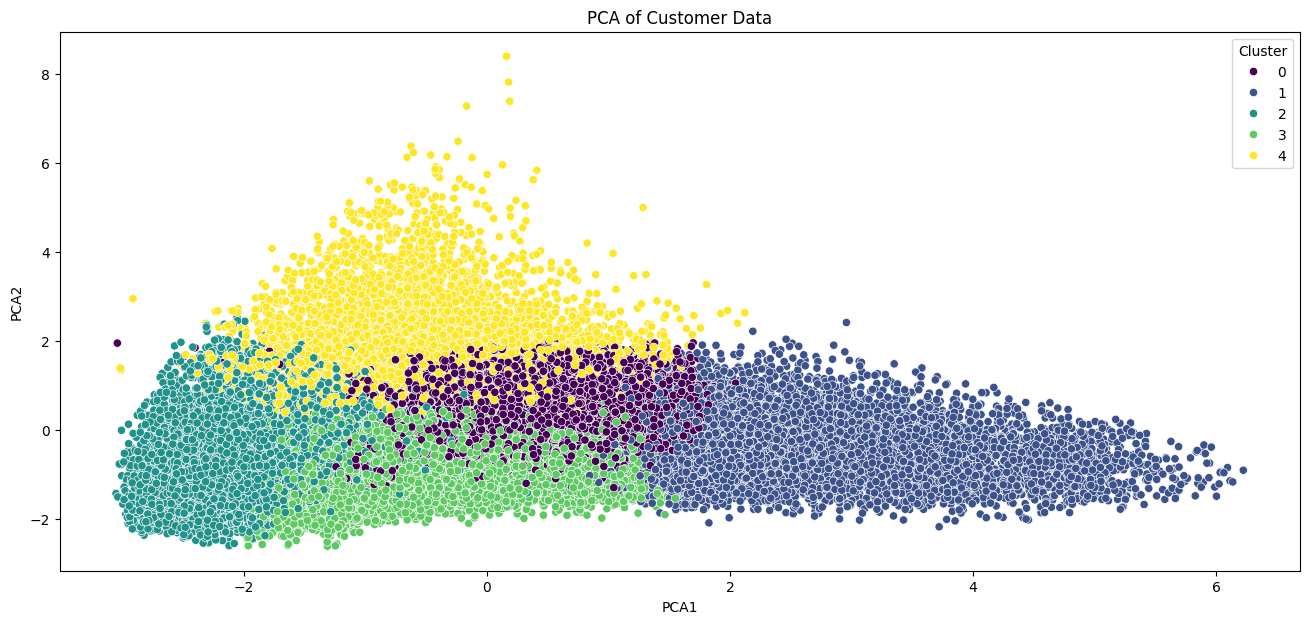
Dimensionality Reduction
Explained 60.99% variance; PC1 driven by Frequency/CLV, PC2 by Unit Cost/Age. Clusters separated but overlapped (e.g., 0 vs. 3).
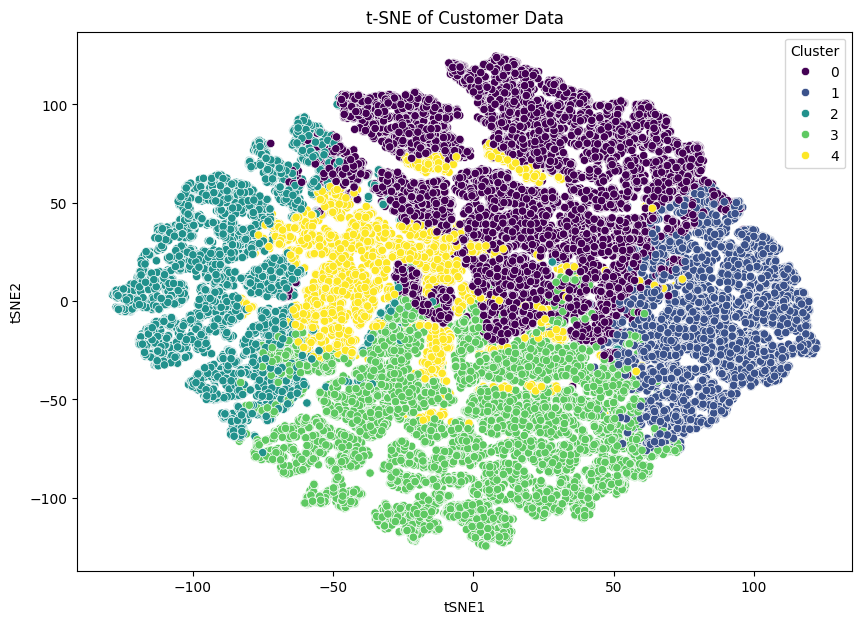
Revealed non-linear clusters; clearer separation (e.g., Cluster 3 high CLV, young) vs. PCA, enhancing segment visualisation.
Conclusion
t-SNE outperformed PCA for visualising clusters (k=5), offering detailed segmentation by CLV, age, and recency. Cluster 3 (young, high CLV, frequent) is key for retention; Cluster 0 (older, low CLV) needs re-engagement strategies. Future work should refine outliers and explore seasonal trends.
Marketing Recommendations
Cluster 0: Mature Budget
Offer loyalty incentives and personalised product recommendations to rebuild engagement and increase CLV.
Cluster 1: Recent Explorers
Capitalise on recency with follow-up communications and cross-sell opportunities to increase order values.
Cluster 3: Young VIPs
Implement premium service offerings and exclusive benefits to maintain high engagement and maximise lifetime value.
Effectiveness of Methods
K-means with k=5 balanced granularity and actionability; hierarchical clustering validated splits. t-SNE's non-linear insight was superior for marketing applications, revealing patterns that PCA's linear approach couldn't detect.