My Data Voyage Visualisation Gallery
Exploring the intersection of machine learning, data science, and visual storytelling through comprehensive analytical projects
Featured Analysis
Comprehensive time series forecasting demonstrating classical and modern approaches
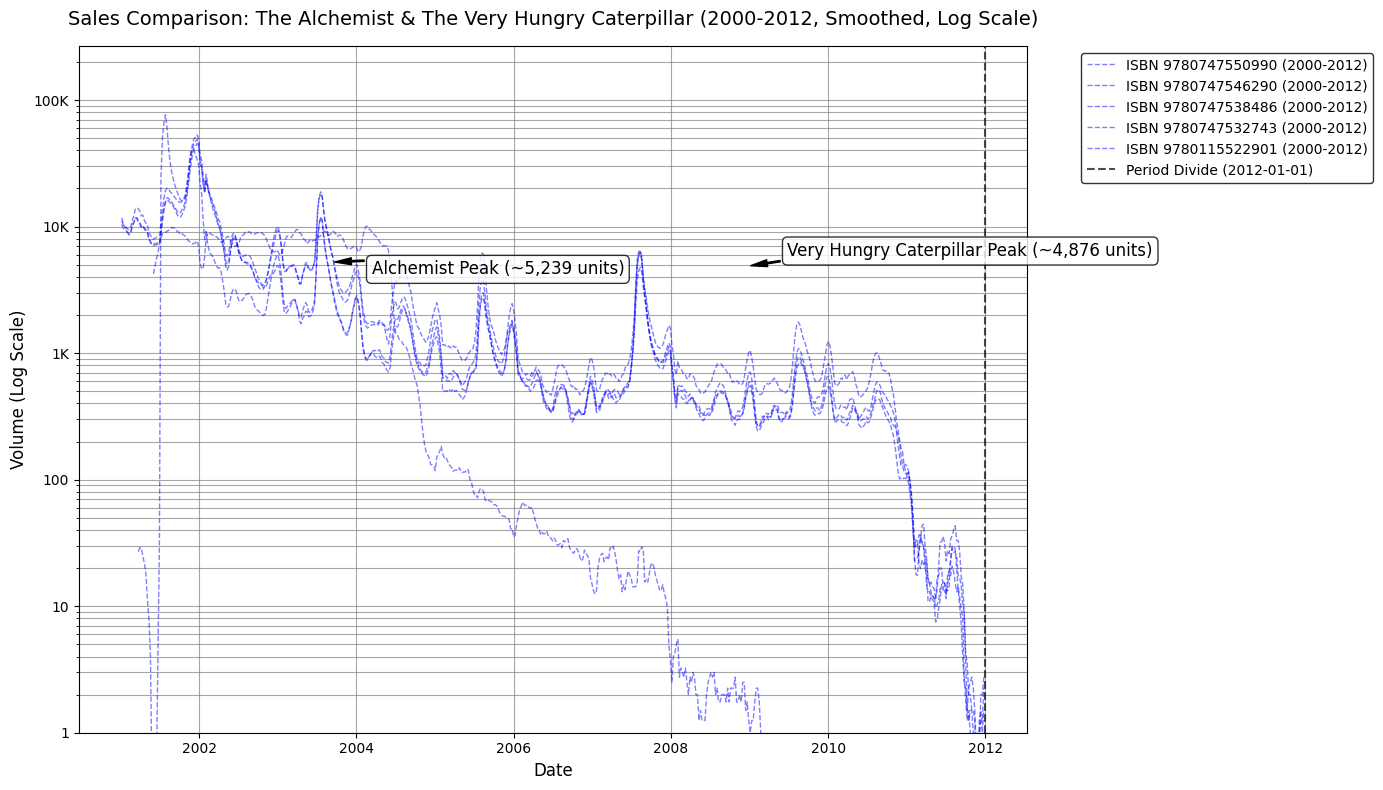
Book Sales Time Series Forecasting
An in-depth analysis of Nielsen BookScan data comparing SARIMA, LSTM, XGBoost, and hybrid models for forecasting book sales. Achieved optimal results with Sequential Hybrid model (MAE: 144.99) for stable patterns and classical SARIMA (MAE: 415.45) for volatile data.
Project Categories
Diverse analytical approaches across multiple domains
Machine Learning
Supervised and unsupervised learning applications
Deep Learning
Neural networks and advanced architectures
Statistical Analysis
Time series and statistical thinking
Educational Visuals
Interactive learning demonstrations
Customer Segmentation with Clustering
Machine Learning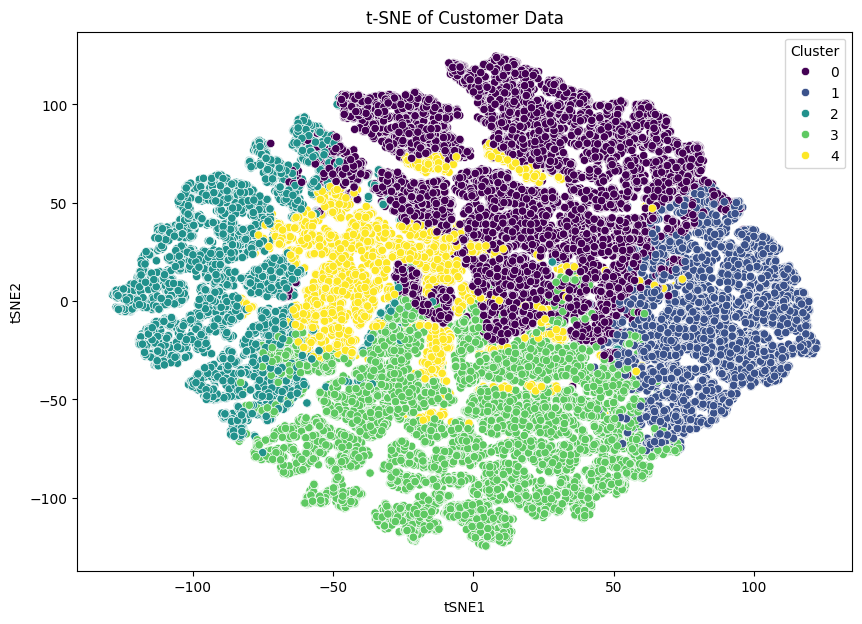
Analysis Process
Data Processing
Processed 951,668 e-commerce orders from 2012-2016 across five continents
Feature Engineering
Created RFM features: Frequency, Recency, CLV, Average Unit Cost, Customer Age
Clustering Analysis
Applied K-means (k=5) and hierarchical clustering with PCA/t-SNE visualisation
Segment Profiling
Identified 5 distinct segments with tailored marketing strategies
Key Findings
Business Impact
Predicting Student Dropout
Supervised Learning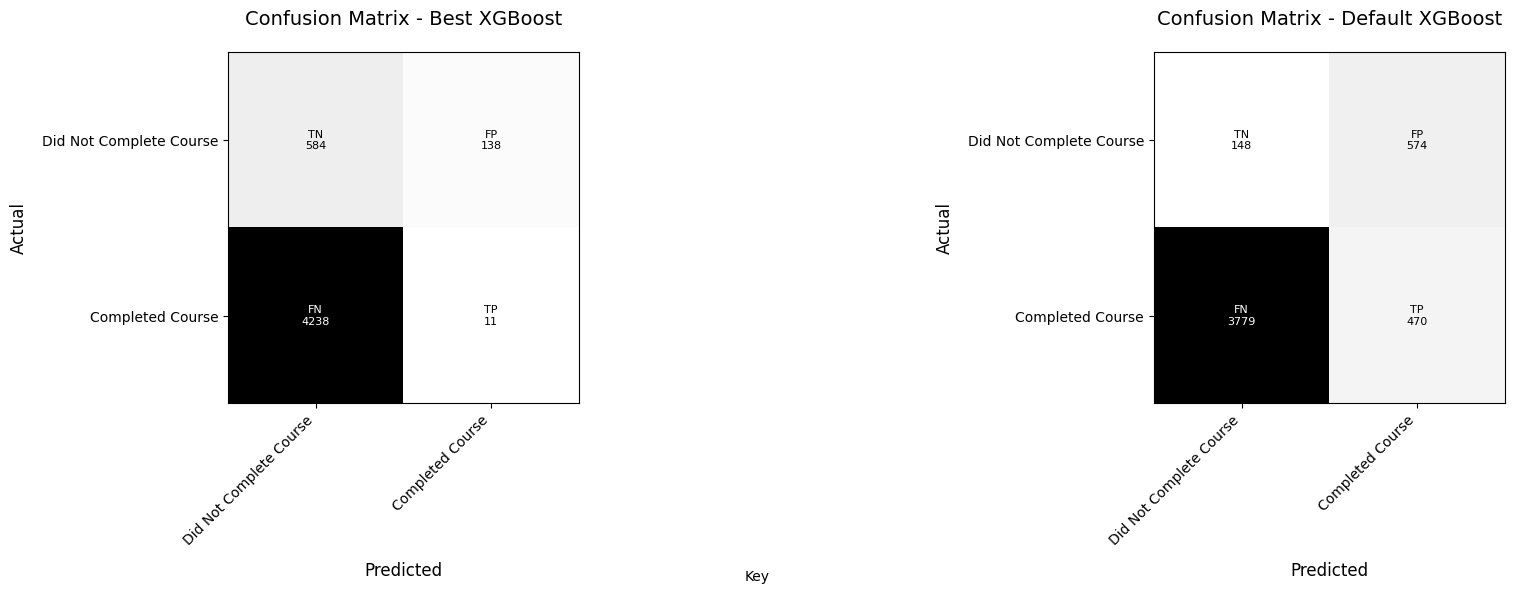
Analysis Process
Three-Stage Analysis
Analysed student data across application, engagement, and academic stages
Model Development
Implemented XGBoost and Neural Networks with stratified sampling
Feature Selection
Identified UnauthorisedAbsenceCount as top predictor in Stage 2
Performance Optimisation
Tuned models achieving 95% recall for engagement-based predictions
Key Findings
Business Impact
Ship Engine Anomaly Detection
Anomaly Detection
Analysis Process
Data Exploration
Analysed 19,535 samples of engine functionality metrics
Statistical Detection
Applied IQR method identifying 2.16% outliers across features
ML Approaches
Implemented One-Class SVM and Isolation Forest algorithms
Model Selection
Selected Isolation Forest (5% contamination) for real-time monitoring
Key Findings
Business Impact
Neural Network for Spam Detection
Deep Learning
Analysis Process
Data Preparation
Processed 4,601 emails with 57 features from Spambase dataset
Architecture Design
Built 64-32-1 sequential model with ReLU and Sigmoid activations
Model Training
Trained with Adam optimizer using binary cross-entropy loss
Performance Evaluation
Achieved 92.3% accuracy on test set validation
Key Findings
Business Impact
Hyperparameter Tuning Visualisation
Educational Visual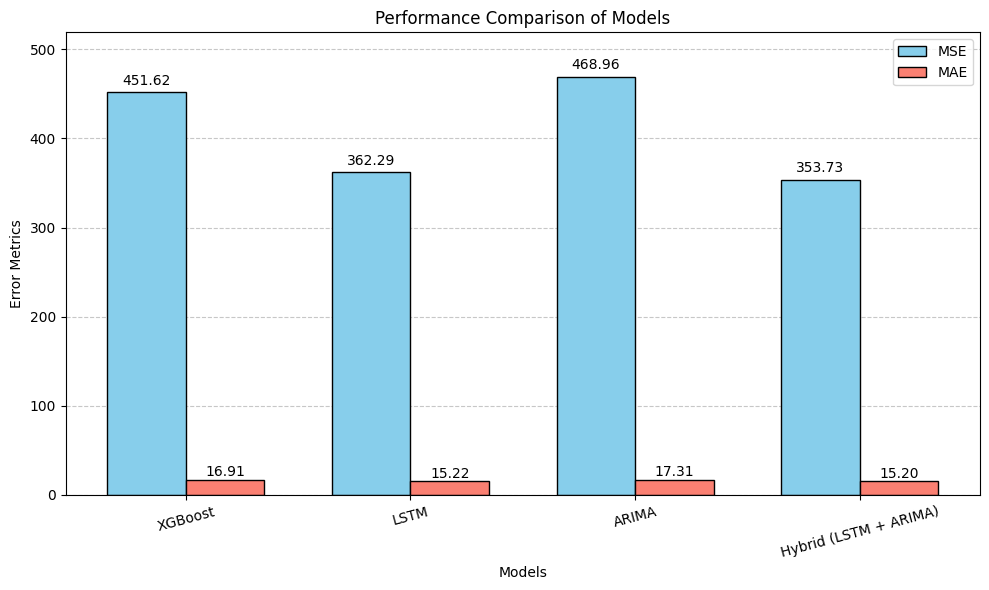
Visualisation Features
Interactive Controls
Real-time adjustment of learning rate, batch size, and epochs
Performance Metrics
Dynamic visualisation of loss curves and accuracy trends
Comparison Views
Side-by-side comparison of different parameter configurations
Educational Insights
Clear explanations of parameter effects on model performance
Key Findings
Educational Impact
Statistical Thinking Visuals
Educational Visual
Visual Components
Probability Distributions
Interactive visualisations of common statistical distributions
Hypothesis Testing
Visual demonstrations of p-values and confidence intervals
Sampling Concepts
Animated explanations of sampling distributions and CLT
Bayesian Thinking
Interactive Bayesian updating and prior/posterior visualisations