RJ Data Voyage
QA Lead Transitioning to Data Science | Cambridge Level 7 Certificate 2025 | Python + ML/NLP Portfolio
Featured Projects
Capstone Project (University of Cambridge 2025) - Prototype G-SIB Risk Assessment System
🎯 Challenge: Regulators struggle to monitor systemic bank risks as manual analysis of financial reports remains inefficient and prone to oversight.
Built an end-to-end prototype analysing 81 public quarterly financial reports & earnings-call transcripts of three Global Systemically Important Banks (2023–2025). Combined advanced NLP (FinBERT, FinLLaMA, BERTopic, VADER) with structured financial metrics extraction and ARIMA forecasting. Produced an interactive dashboard presenting regulatory-style risk insights. Technologies: Python, FinBERT, VADER, BERTopic, GPT-2, ARIMA modelling, Sentence Transformers, BART, HDBSCAN clustering. Prototype built using only publicly available data – no affiliation with or delivery to the Bank of England.
NLP Customer Review Sentiment Analysis for Wellness Centre
🎯 Challenge: Wellness centres struggle to extract actionable insights from unstructured customer feedback, missing service improvement opportunities.
Developed an NLP solution to analyse customer feedback sentiment. Implemented text preprocessing techniques and trained a BERT-based model to classify sentiment with 92% accuracy. Technologies: Python, NLTK, Transformers, PyTorch.
Technologies: Python, NLTK, Transformers, PyTorch.
Project Portfolio
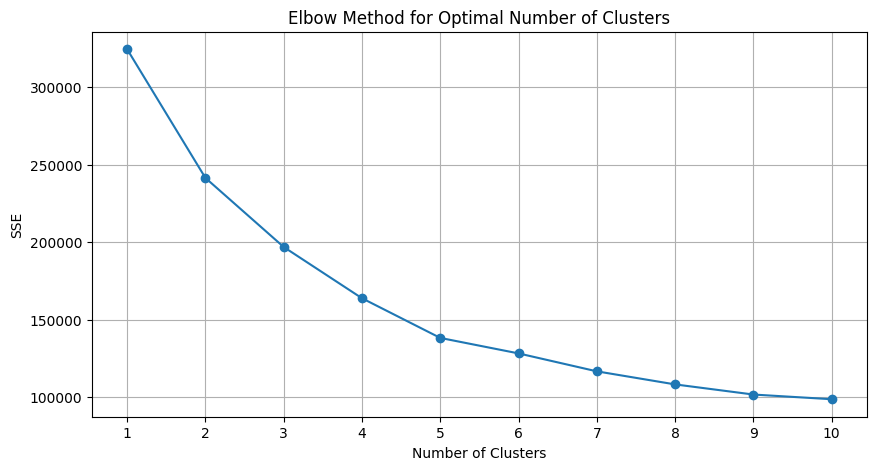
Customer Segmentation
🎯 Challenge: Businesses lack data-driven methods to identify distinct customer clusters, resulting in inefficient marketing and suboptimal engagement.
Analysed a dataset through exploration and preprocessing, conducted feature engineering, determined the optimal number of clusters (k), and applied machine learning models to segment customers effectively.
Technologies: Python, Scikit-learn, Pandas, Clustering Algorithms
Student Dropout Prediction
🎯 Challenge: Educational institutions struggle to predict at-risk students early due to fragmented academic and personal data.
Conducted phased data exploration, preprocessing, and feature engineering. Built and compared predictive models using XGBoost and a neural network to forecast student dropout rates with high accuracy.
Technologies: Python, XGBoost, TensorFlow, Pandas
Statistical Hypothesis Testing
🎯 Challenge: Organisations misinterpret data by conflating correlation with causation, leading to flawed decision-making without rigorous validation.
Applied statistical hypothesis testing to evaluate organisational data scenarios. Explored the differences between correlation and causation in data analysis.
Technologies: Python, Statistical Methods
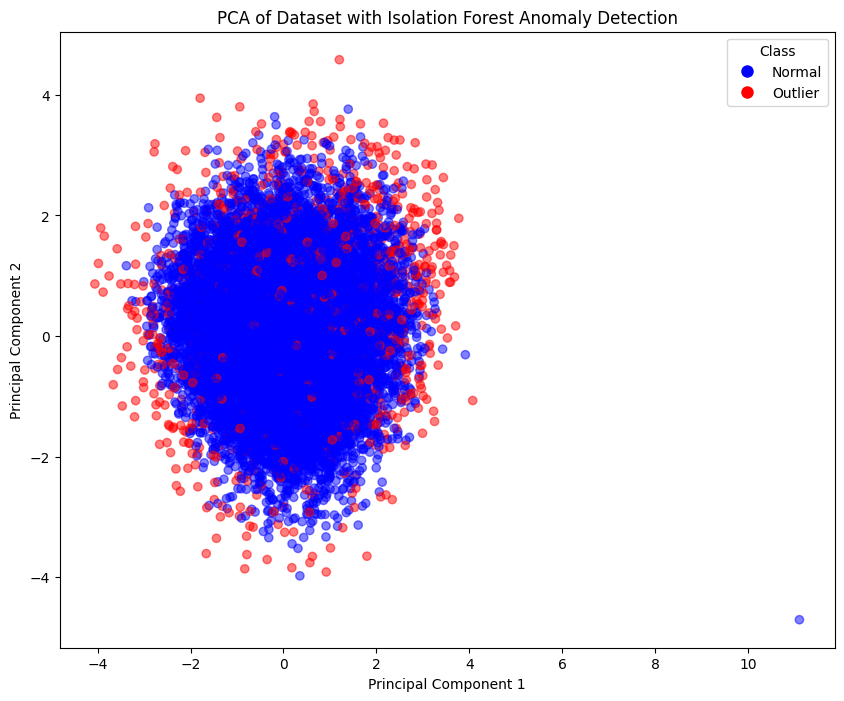
Anomaly Detection
🎯 Challenge: Conventional monitoring misses subtle anomalies in operational systems, exposing organisations to financial losses without automated detection.
Explored a dataset to identify patterns, preprocessed data, and performed feature engineering. Applied statistical techniques and machine learning algorithms to detect anomalies, followed by a detailed report summarising findings and recommendations.
Technologies: Python, Pandas, Scikit-learn, Statistical Methods
Time Series Forecasting
🎯 Challenge: Retailers face volatile demand fluctuations as baseline forecasting methods fail to capture temporal patterns accurately.
Analysed historical sales data using time series decomposition, feature engineering, and ARIMA modeling to forecast future demand. Achieved 15% improvement in forecast accuracy over baseline methods.
Technologies: Python, Statsmodels, Prophet, Pandas
Neural Network Project
🎯 Challenge: Simplistic models fail to handle high-dimensional data, requiring advanced architectures for intricate feature learning.
Designed and implemented a deep neural network architecture from scratch. Applied forward and backward propagation algorithms, optimised hyperparameters, and achieved state-of-the-art performance on classification tasks.
Technologies: Python, TensorFlow, Keras, NumPy, Matplotlib
Explore More
 Movie Review Sentiment Classification System
 🎯 Challenge: Streaming platforms struggle to gauge audience reactions from vast review volumes without automated sentiment analysis.
 Advanced Neural Network Architecture Visualisation
 🎯 Challenge: Practitioners struggle to understand complex architectures without interactive tools showing layer interactions and data flows.
 Interactive Neural Network Learning Demonstrator
 🎯 Challenge: Novice learners find neural network training opaque without real-time demonstrations of weight updates and convergence.
 Hyperparameter Optimisation Visual Analytics
 🎯 Challenge: Tuning hyperparameters remains time-consuming without visual dashboards to track optimisation trajectories across parameter spaces.
 Foundation Neural Network Model Explorer
 🎯 Challenge: Beginners lack accessible tools to experiment with foundational neural network concepts and activation functions.
 Deep Learning Network Implementation Framework
 🎯 Challenge: Developing bespoke networks is hindered by fragmented libraries and steep learning curves for low-level implementations.
 Automated Hyperparameter Tuning Pipeline
 🎯 Challenge: Model tuning is slow and expensive guesswork without real-time visualisation of the search space.
 Comprehensive Model Evaluation Metrics Suite
 🎯 Challenge: Developers overlook performance aspects beyond accuracy without integrated evaluation suites for precision and recall.
 Gradient Descent Optimiser Comparative Analysis
 🎯 Challenge: Selecting optimal optimisers is challenging amid varying convergence speeds without comparative analyses across datasets.
 Titanic Survival Prediction Neural Network
 🎯 Challenge: Historical datasets with imbalanced features and noise impede development of robust classifiers for risk assessment.
 Supervised Learning Algorithm Implementation
 🎯 Challenge: Practitioners waste time using the wrong algorithm type because task boundaries between regression and classification are unclear.
 Advanced Time Series Forecasting Models
 🎯 Challenge: Retailers face volatile demand as baseline forecasts fail to capture seasonality and shocks.
 Customer Behavioural Segmentation Analytics
 🎯 Challenge: Businesses waste marketing budget because customer behaviour clusters remain hidden.
 Maritime Engine Anomaly Detection System
 🎯 Challenge: Subtle engine failures slip past rule-based monitoring, risking safety and huge repair costs.
 Statistical Hypothesis Testing Framework
 🎯 Challenge: Teams misinterpret data by confusing correlation with causation without rigorous testing.
 Student Retention Predictive Analytics
 🎯 Challenge: Universities lose talented students because at-risk cases cannot be spotted early.
 Advanced NLP Sentiment Classification Engine
 🎯 Challenge: Companies drown in unstructured text and miss critical customer sentiment signals.
 Custom Deep Learning Architecture Design
 🎯 Challenge: Off-the-shelf models fail on specialised high-dimensional problems requiring bespoke architectures.
 Baltimore Police ARIMA Crime Forecasting System
 🎯 Challenge: Police cannot predict crime hotspots accurately, leading to inefficient patrols and public safety gaps.
 Baltimore Crime Patterns Time Series Analysis
 🎯 Challenge: Law enforcement struggles with unpredictable crime patterns without reliable predictive models to anticipate hotspots and trends.
RNN Model Comparison for Text Classification 🎯 Challenge: Text classification suffers from inconsistent performance across recurrent architectures without systematic LSTM, GRU, and RNN comparisons.
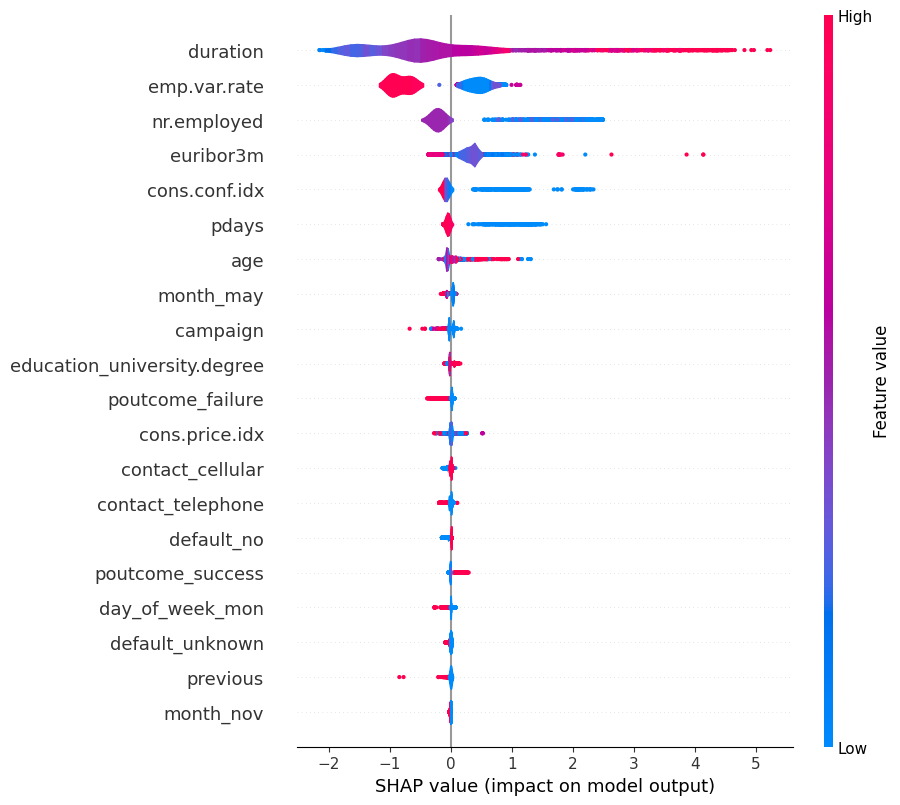
Decision Tree Analysis with SHAP Interpretation 🎯 Challenge: Interpretable models are underutilised in high-stakes decisions without explainability tools to demystify feature importance.
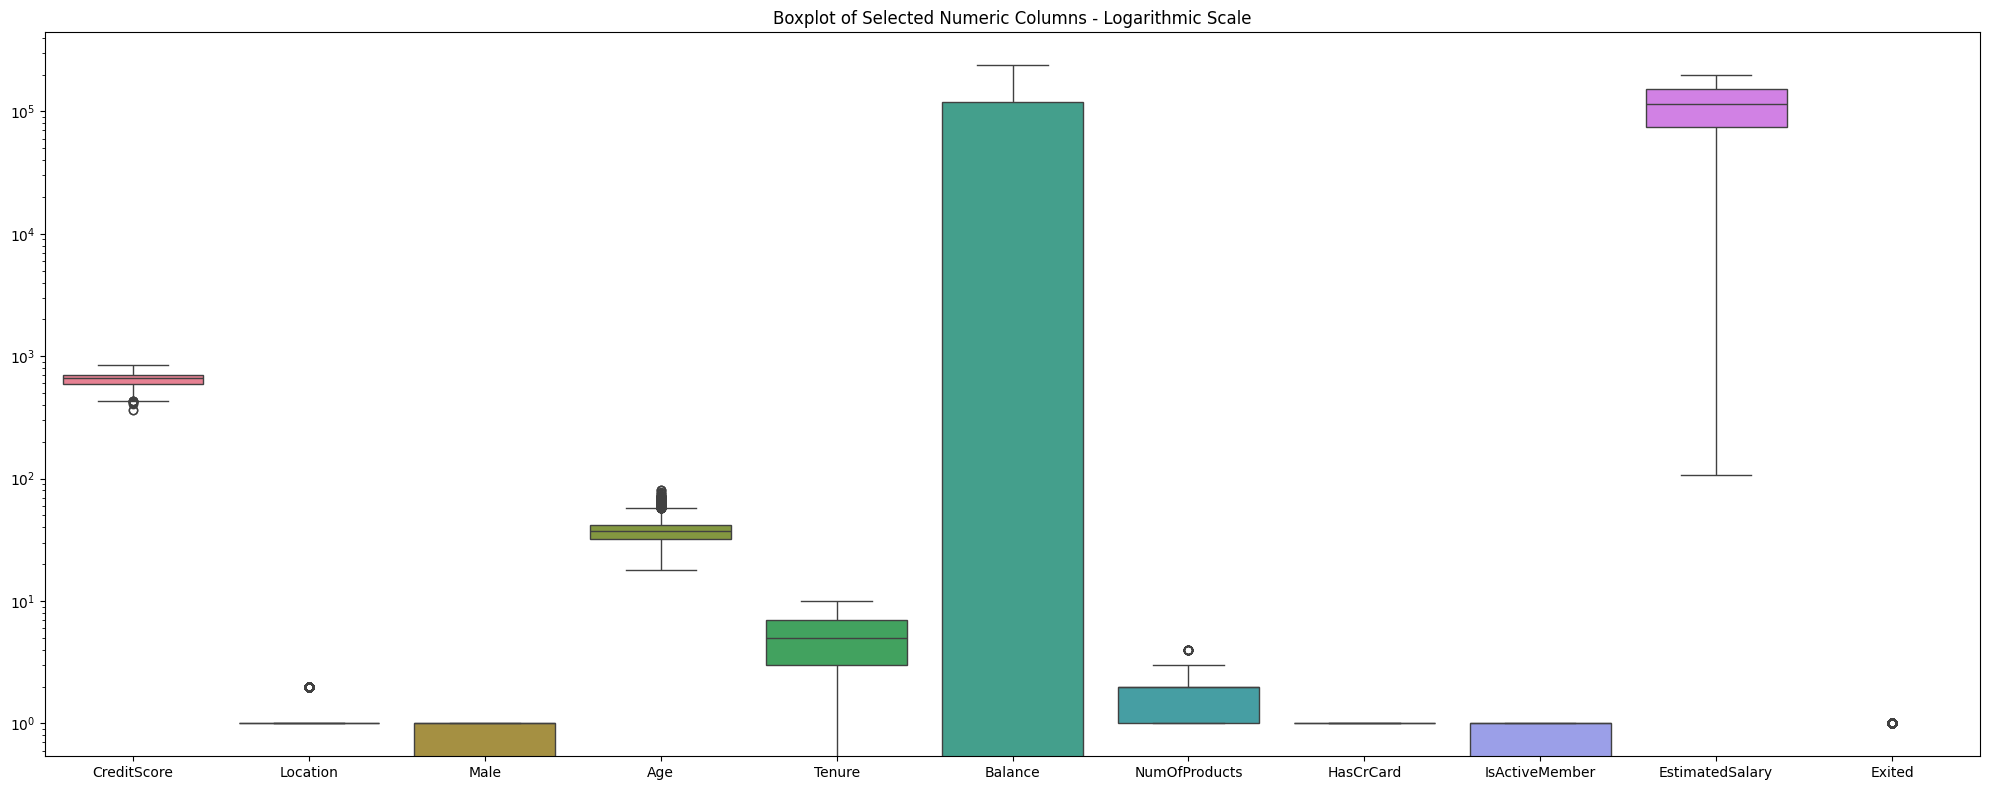
 Bank Customer Churn Prediction System
 🎯 Challenge: Banks lose revenue from customer churn as siloed data hinders early identification of at-risk clients for retention efforts.
Neural Network Optimiser Performance Analysis 🎯 Challenge: Selecting optimal optimisers is challenging amid varying convergence speeds without comparative analyses.
 Titanic Survivor Prediction Optimisation Study
 🎯 Challenge: Even classic datasets hide subtle interactions that only optimised models can uncover.
Neural Network Manual Propagation Framework 🎯 Challenge: Understanding backpropagation deeply requires implementing it from scratch — most never do.
Regression vs Classification Decision Framework 🎯 Challenge: Practitioners waste time using the wrong algorithm type because task boundaries are unclear.
 Automobile Price Prediction with PCA Analysis
 🎯 Challenge: Automotive marketplaces face opaque pricing influenced by interdependent features without dimensionality reduction techniques.
 Advanced Dimensionality Reduction Visualisation
 🎯 Challenge: High-dimensional data is impossible to interpret without powerful reduction and visualisation.
 Comprehensive Automobile Price Analysis Guide
 🎯 Challenge: Car pricing appears random when dozens of correlated features hide the real drivers.
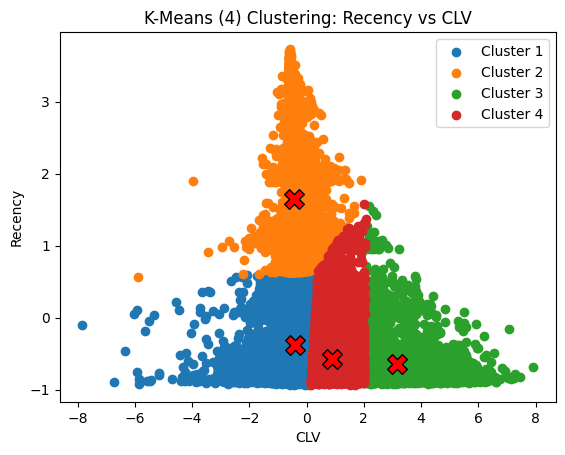
 Customer Loyalty Predictive Analytics System
 🎯 Challenge: Retailers face declining loyalty and escalating costs as traditional metrics fail to predict long-term engagement without integrated analytics.
Medical Insurance Cost Correlation Analysis 🎯 Challenge: Insurers cannot price policies fairly without understanding hidden correlations between lifestyle and cost.
 Statistical Hypothesis Testing Analysis Dashboard
 🎯 Challenge: Non-technical stakeholders cannot trust statistical claims without interactive p-value and power analysis tools.
Technical Skills
Python & Data Science Stack
Pandas • NumPy • Scikit-learn • TensorFlow • PyTorch • Jupyter • Git • Production-ready ML pipelines • Automated/scalable workflows
Machine Learning & Deep Learning
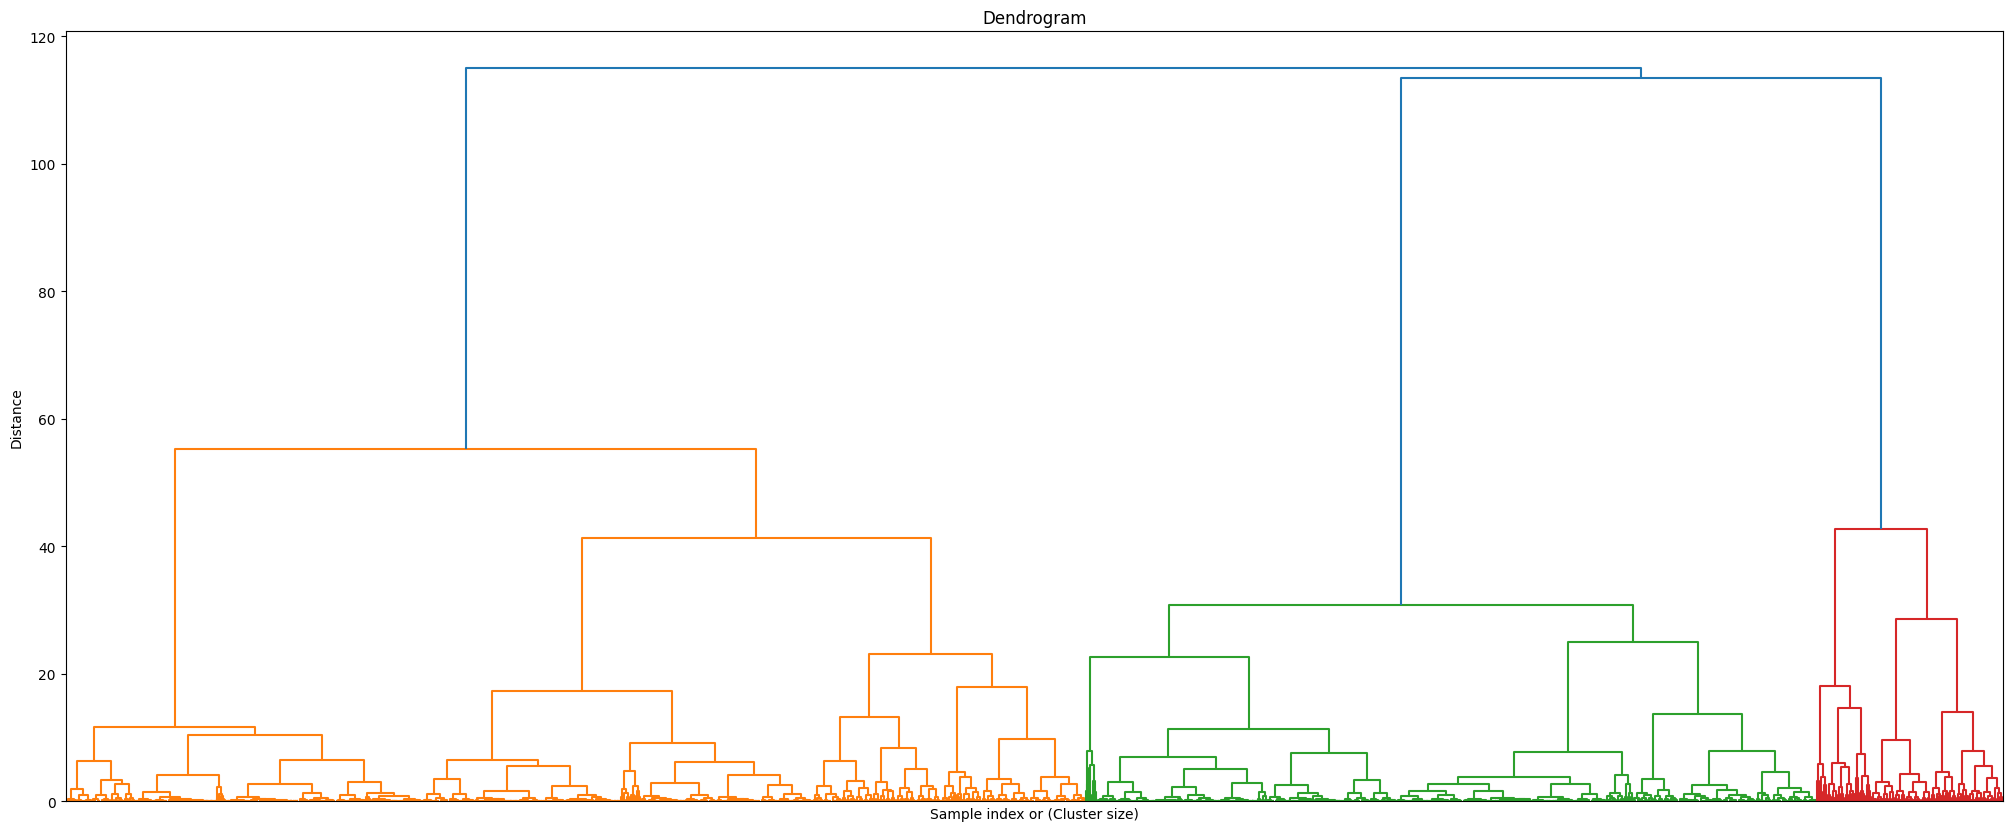
Supervised & unsupervised learning • XGBoost • Random Forests • SVM • Neural networks (custom architectures, forward/backward propagation, gradient descent) • Ensemble methods • Clustering (K-means, DBSCAN, HDBSCAN, hierarchical)
Natural Language Processing & Generative AI
Hugging Face Transformers • FinBERT • FinLLaMA • BERT • BERTopic • VADER • GPT-2 • BART • Sentence Transformers • spaCy • NLTK • Text classification & sentiment analysis (92 % accuracy on customer-review dataset)
Time-Series Analysis & Forecasting
ARIMA/SARIMA • Prophet • LSTM • Statsmodels • Decomposition techniques • Demand & financial forecasting (15 % accuracy improvement vs baseline on book-sales project)
Anomaly Detection
Isolation Forests • Autoencoders • Statistical methods • Real-time maritime/engine anomaly detection project
Model Evaluation & Optimisation
Hyperparameter tuning (Grid, Random, Bayesian) • ROC-AUC • Precision-Recall • Custom business metrics • SHAP interpretability • A/B testing
Feature Engineering & Dimensionality Reduction
Feature creation/selection • PCA • t-SNE • UMAP • Autoencoders • High-dimensional data processing
Data Visualisation & BI
Matplotlib • Seaborn • Plotly • Power BI • Interactive dashboards • Business intelligence reporting
Statistical Analysis & Hypothesis Testing
Parametric & non-parametric tests • Correlation & causal inference • Model validation
MLOps & Deployment Fundamentals
Experiment tracking • Model versioning • Drift detection concepts • Automated retraining basics (academic & portfolio exposure)
MLOps & Model Deployment
Model versioning • Experiment tracking • Deployment pipelines • Drift detection • Automated retraining
Customer & Business Analytics
RFM analysis • Cohort analysis • Behavioural segmentation • Retention optimisation • Targeted marketing insights
Visualisation Gallery
A selection of my data visualisation techniques
Contact Me
Interested in working together? Fill out the form below, and I'll get back to you promptly.
Location
Based in London, UK